Predicting Telecom Customer Churn with Explainable AI
Problem
Customer churn is one of the biggest challenges in the telecom industry. Acquiring new customers costs significantly more than retaining existing ones. The key business question was: “Can we predict which customers are likely to churn, and explain why, so retention teams can take targeted action?”
My Approach
1) Data Understanding & Feature Engineering
I worked with the Kaggle Telecom Churn dataset. To make the model more powerful, I created business-relevant features such as average call duration, total charges, international call ratio, and grouped states.
2) Model Development & Tuning
Compared Logistic Regression, Random Forest, and XGBoost using 5-fold Stratified CV. After tuning, XGBoost delivered the best results.
- Logistic Regression — CV AUC: 0.8107 (C=0.1)
- Random Forest — CV AUC: 0.9223 (max_depth=10, n_estimators=200)
- XGBoost — CV AUC: 0.9310 (eta=0.01, max_depth=6, n_estimators=200)
- Hold-out Test — AUC: 0.9249, Recall: 0.8737, Precision: 0.9432
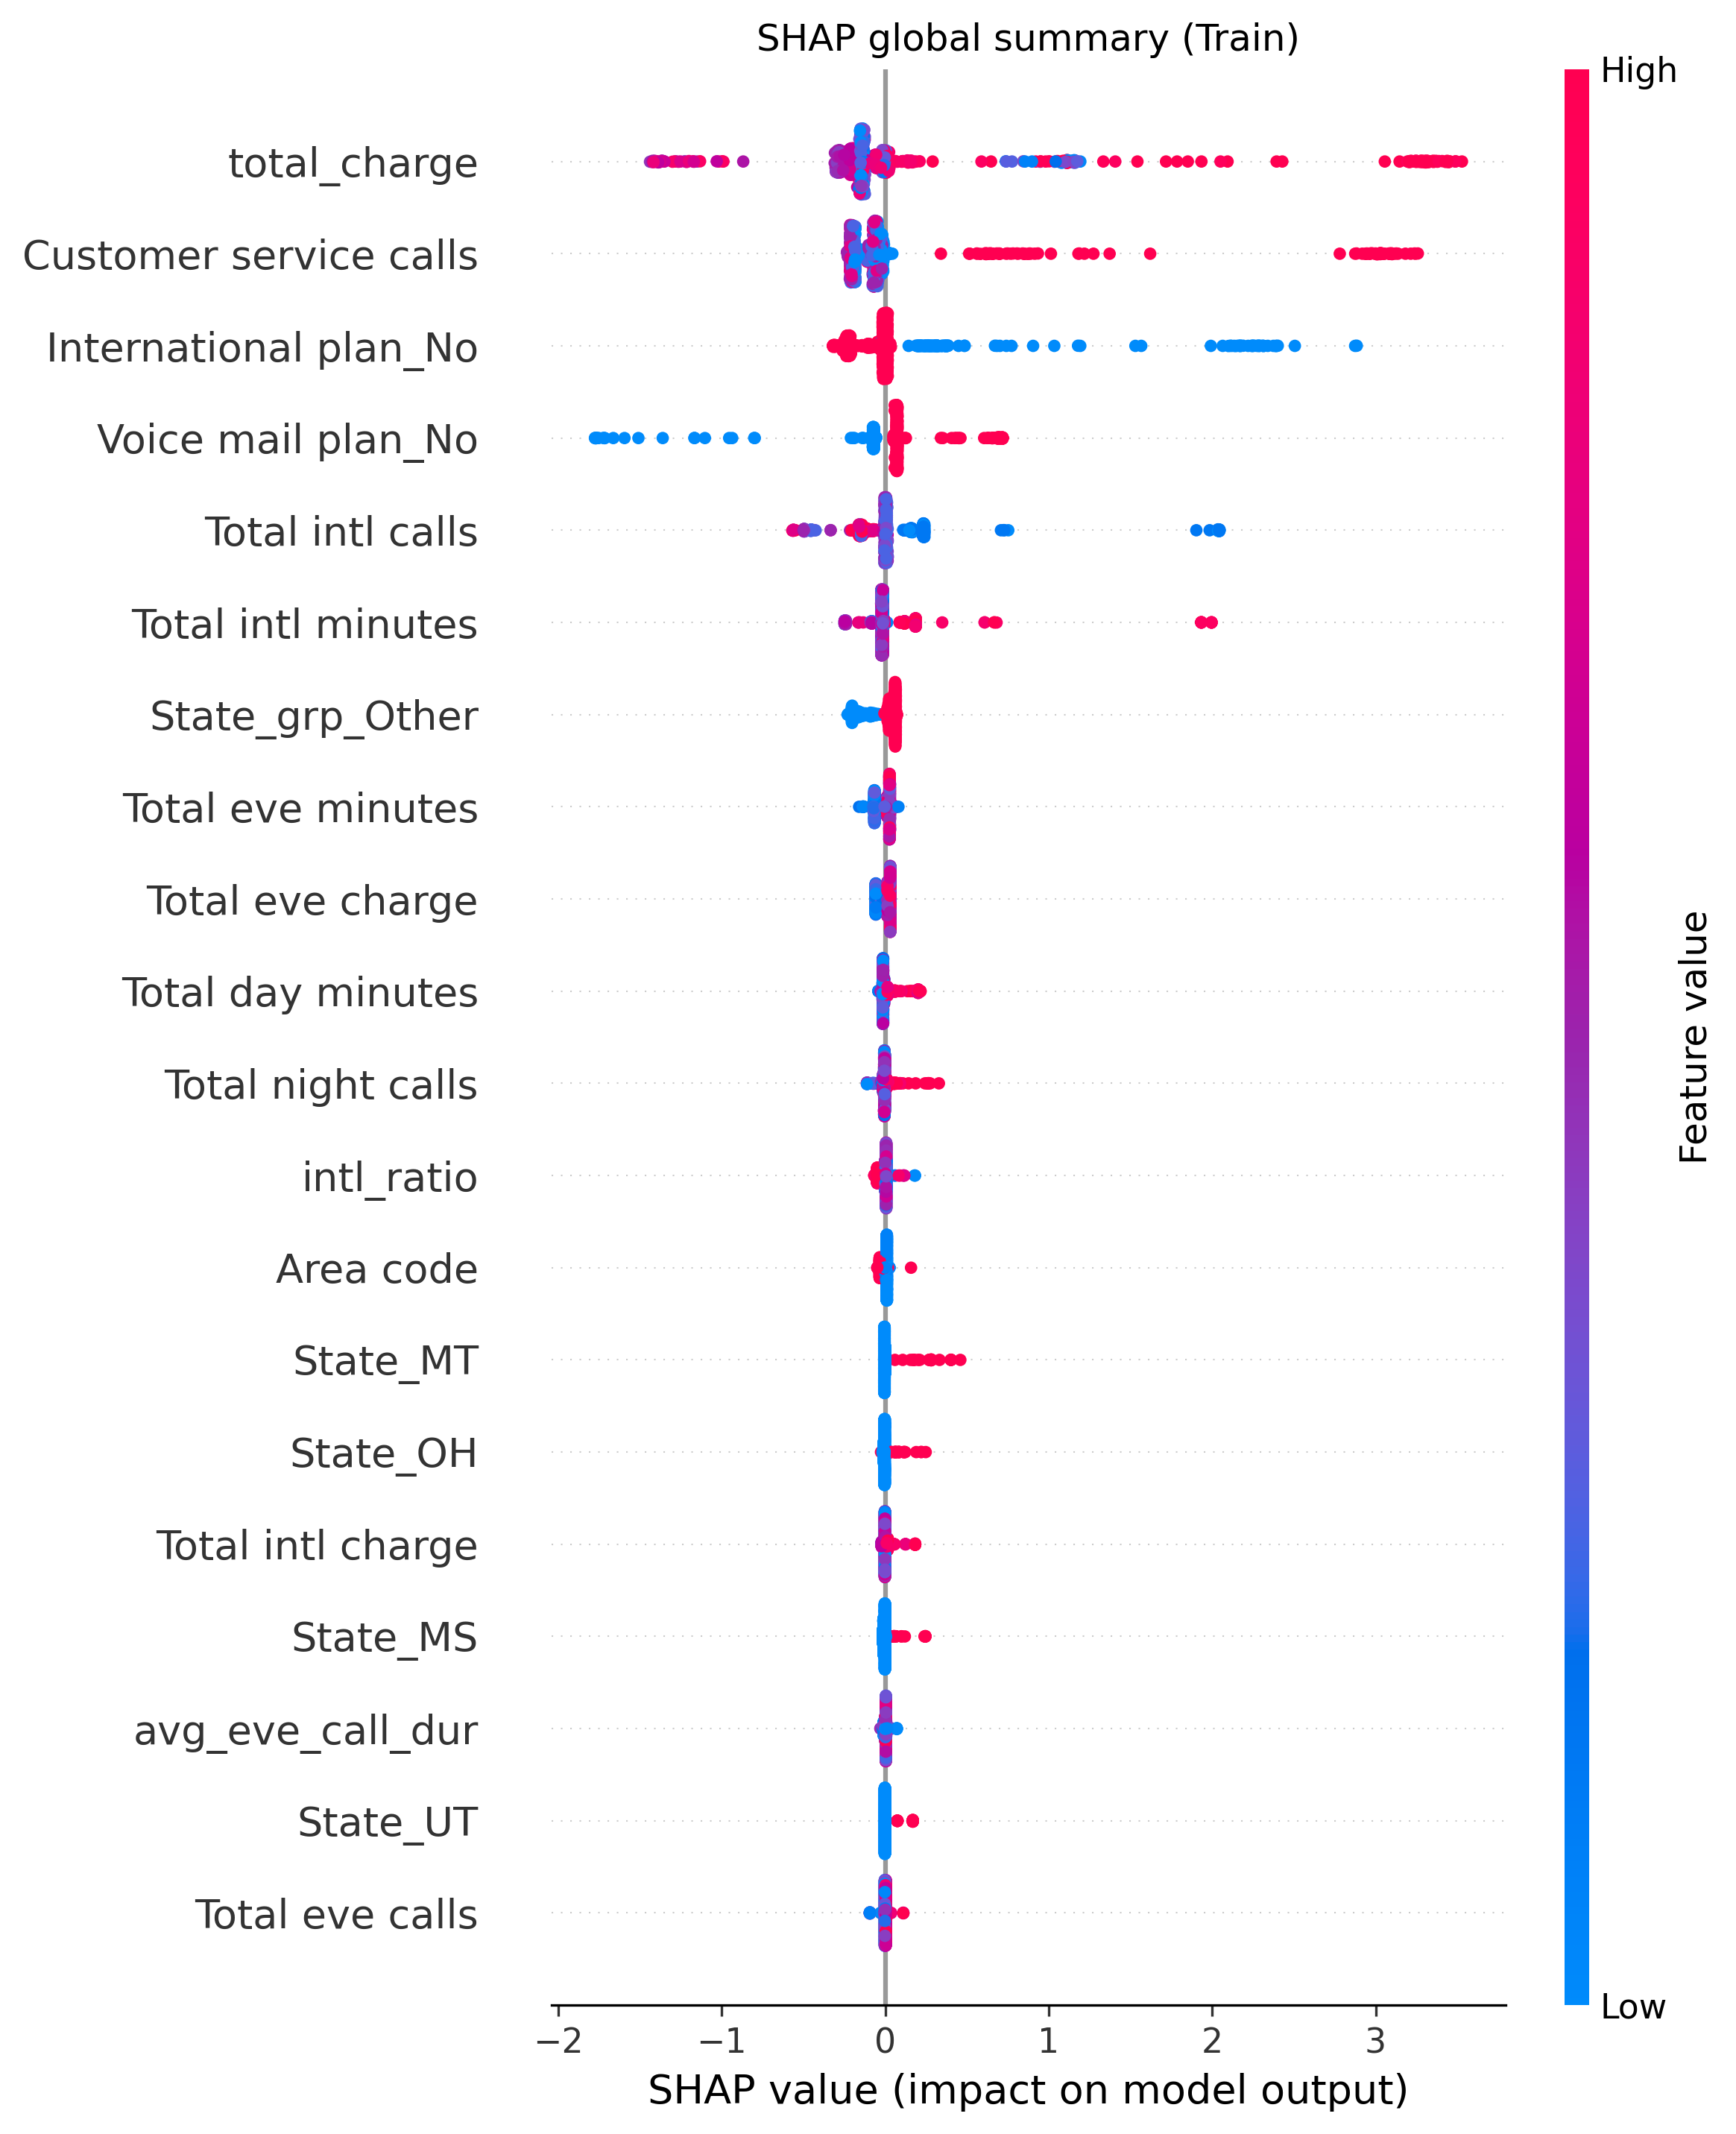
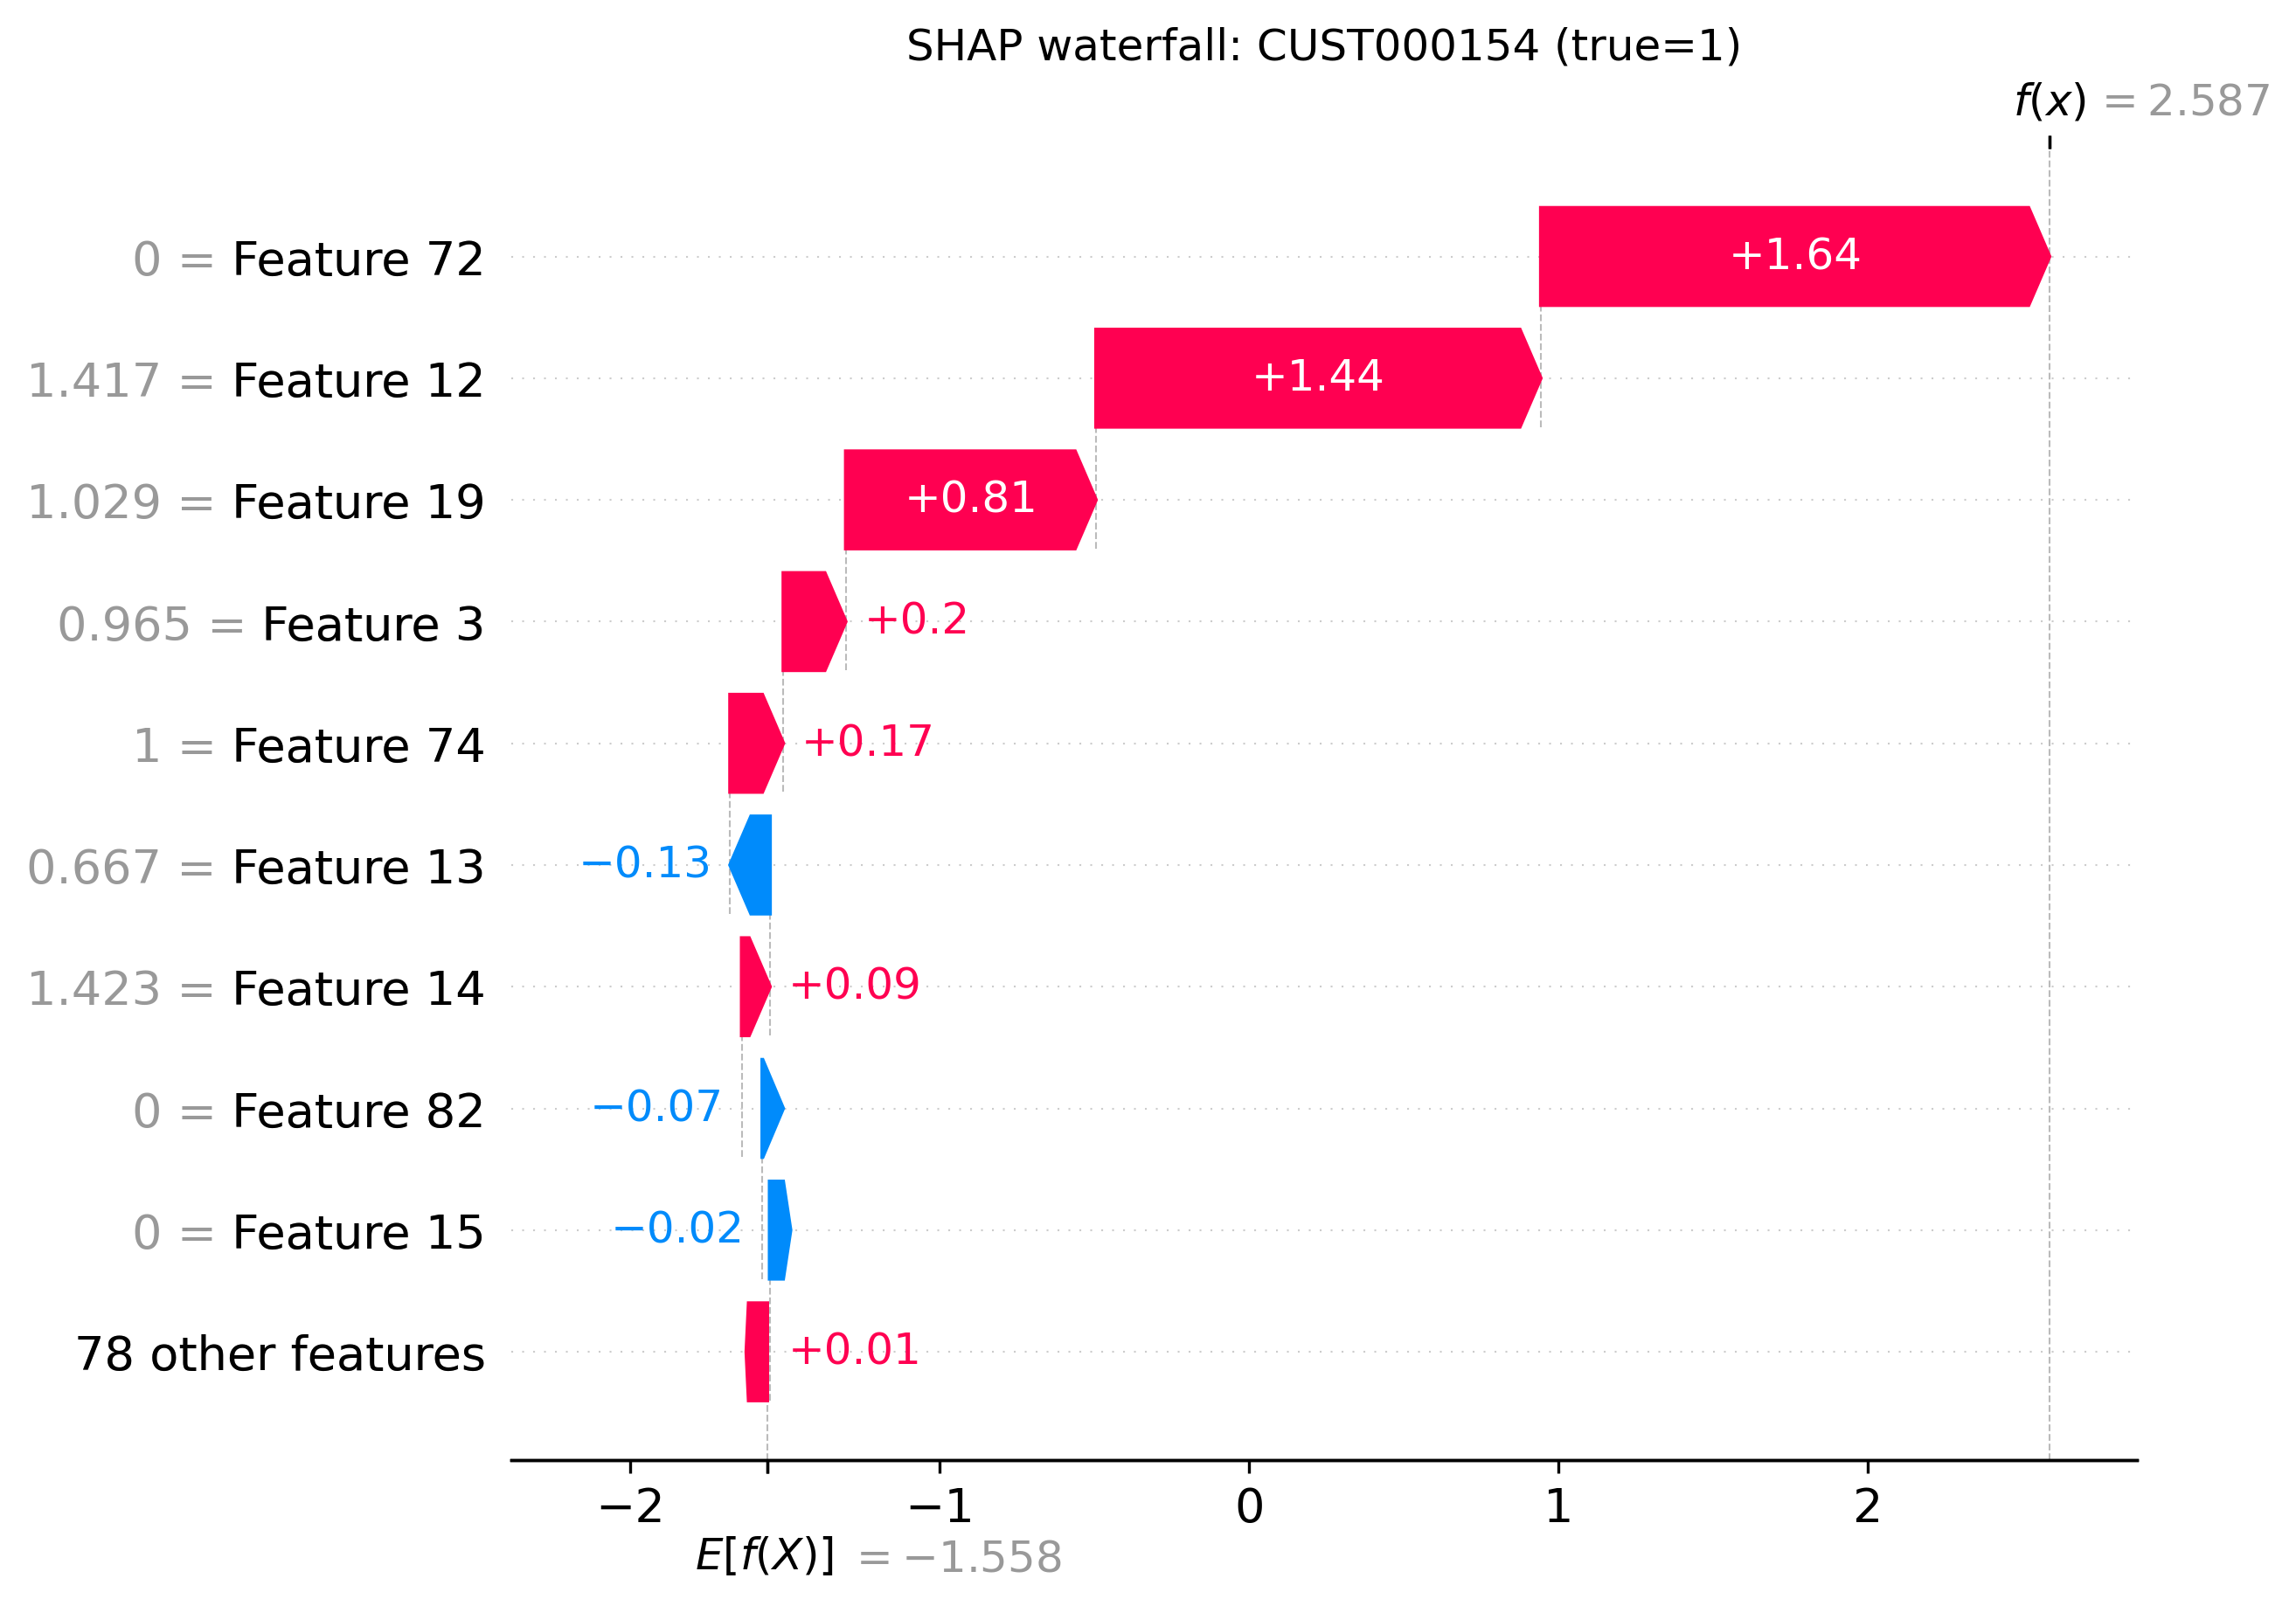
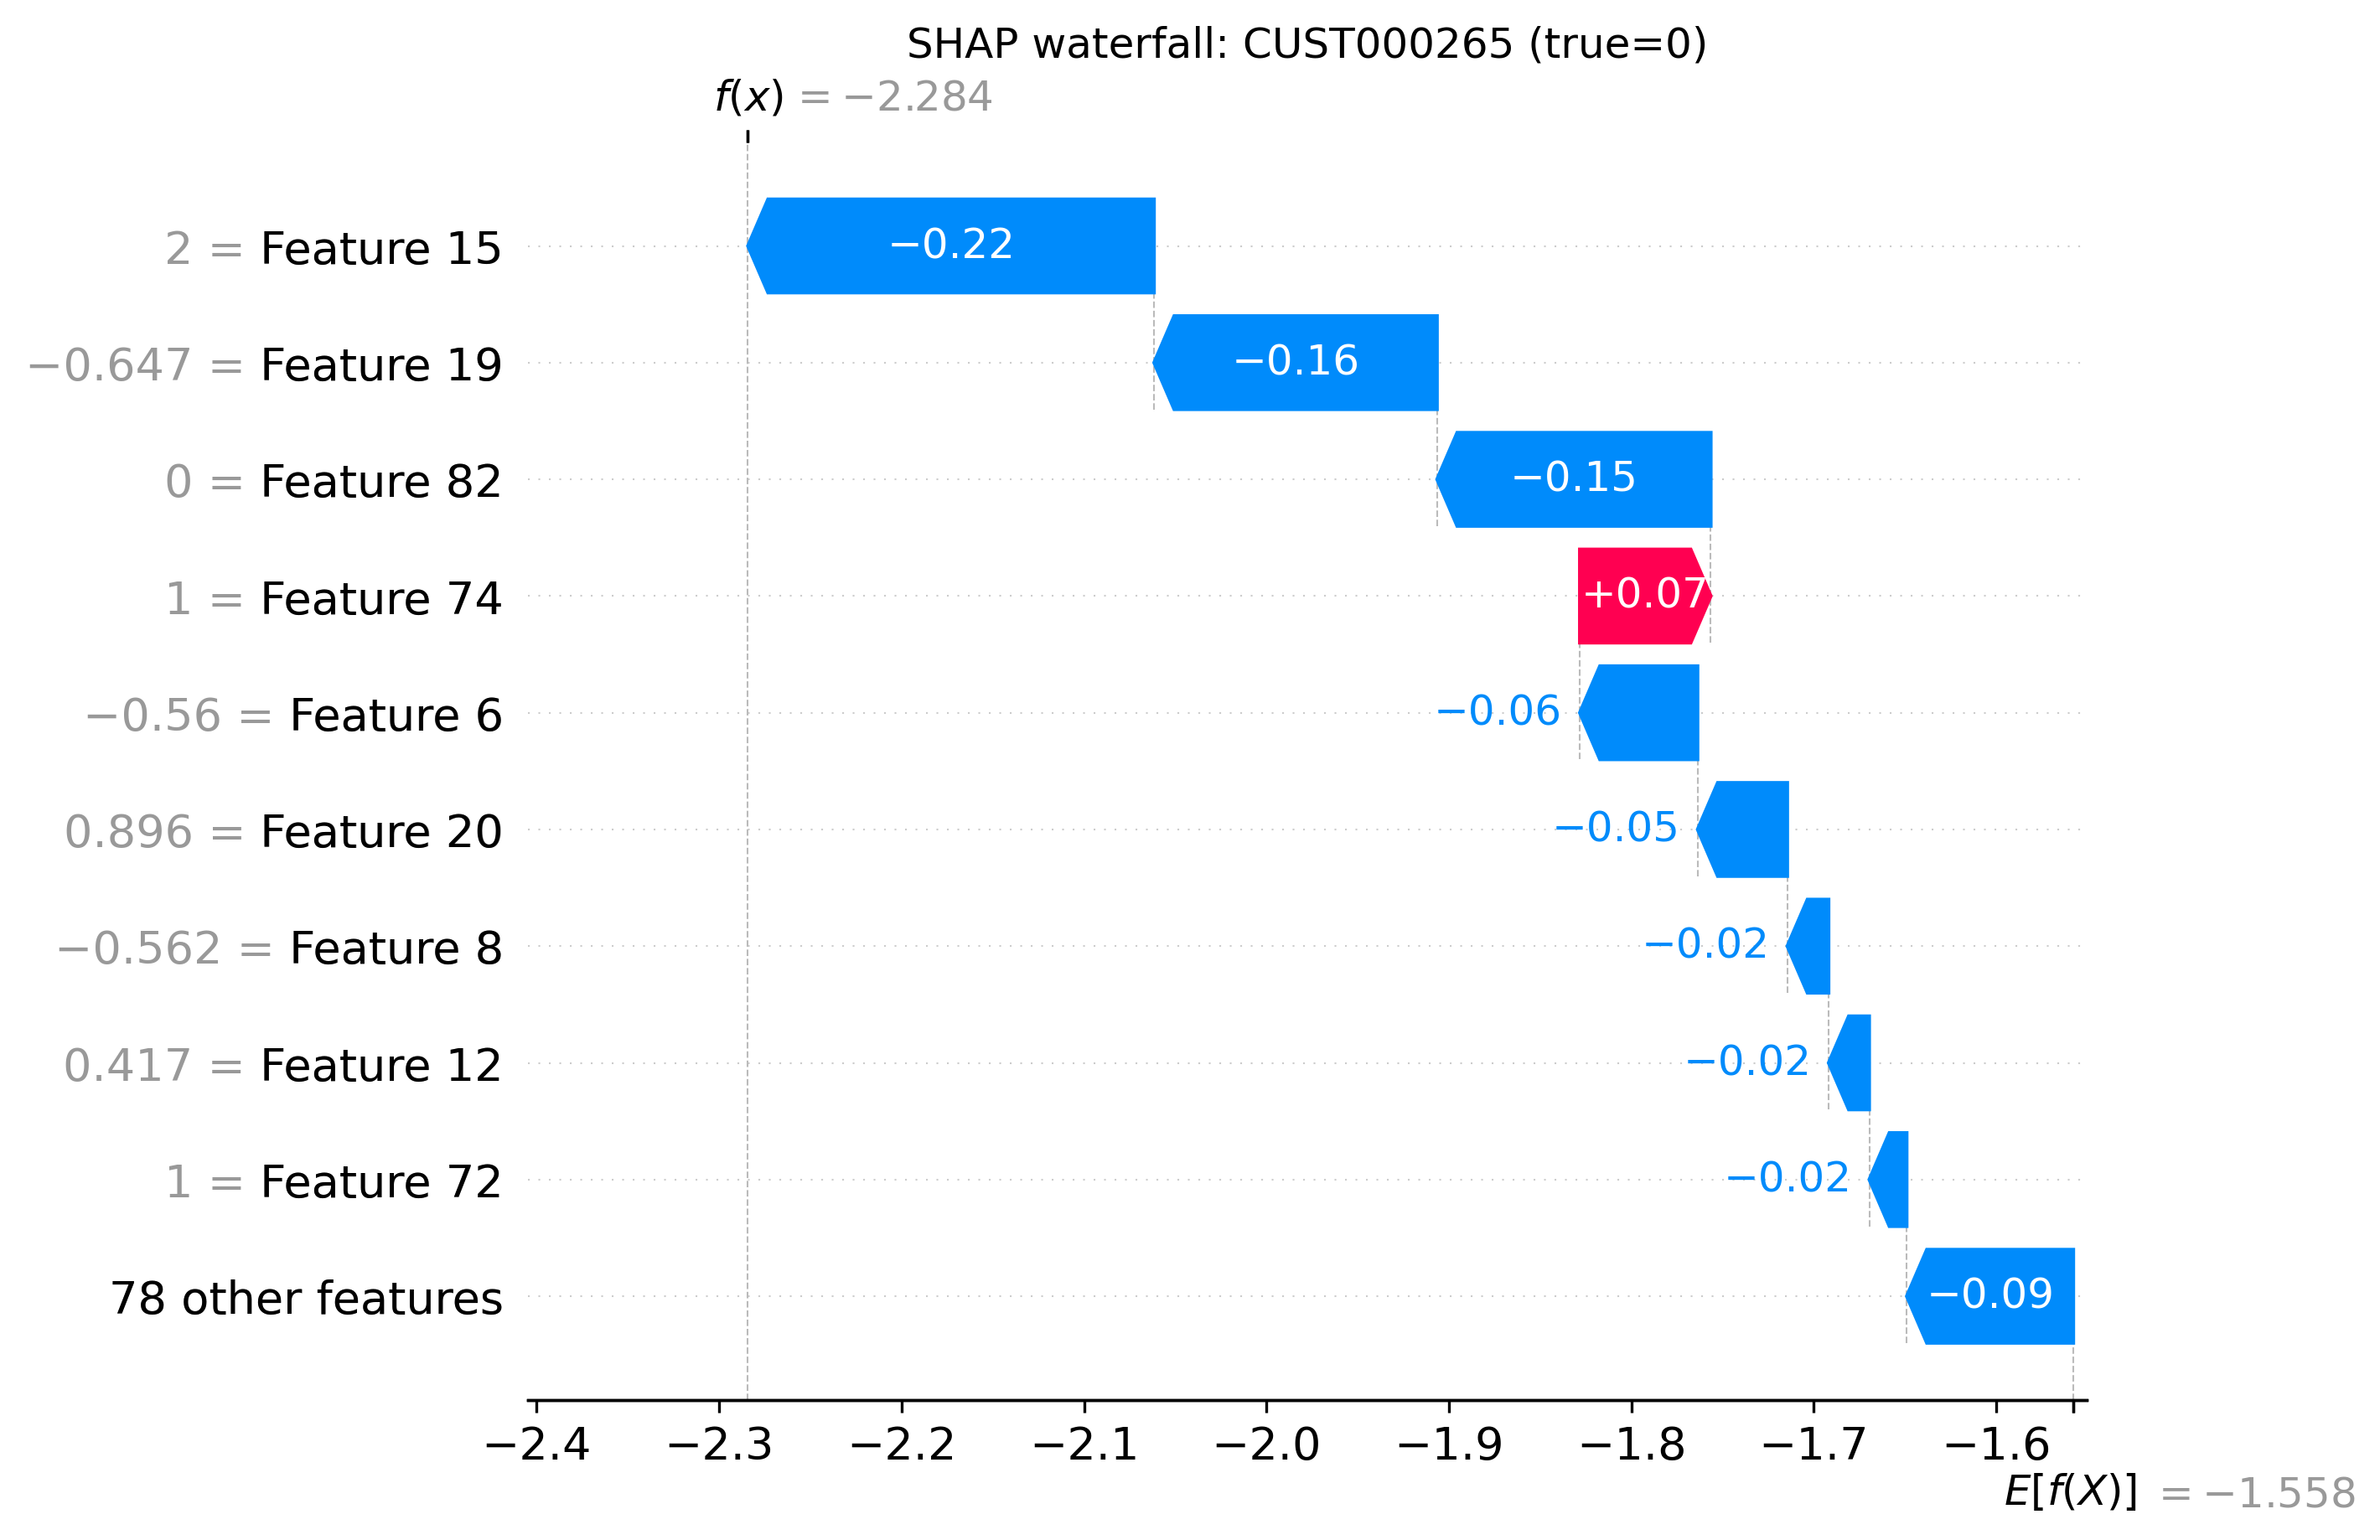
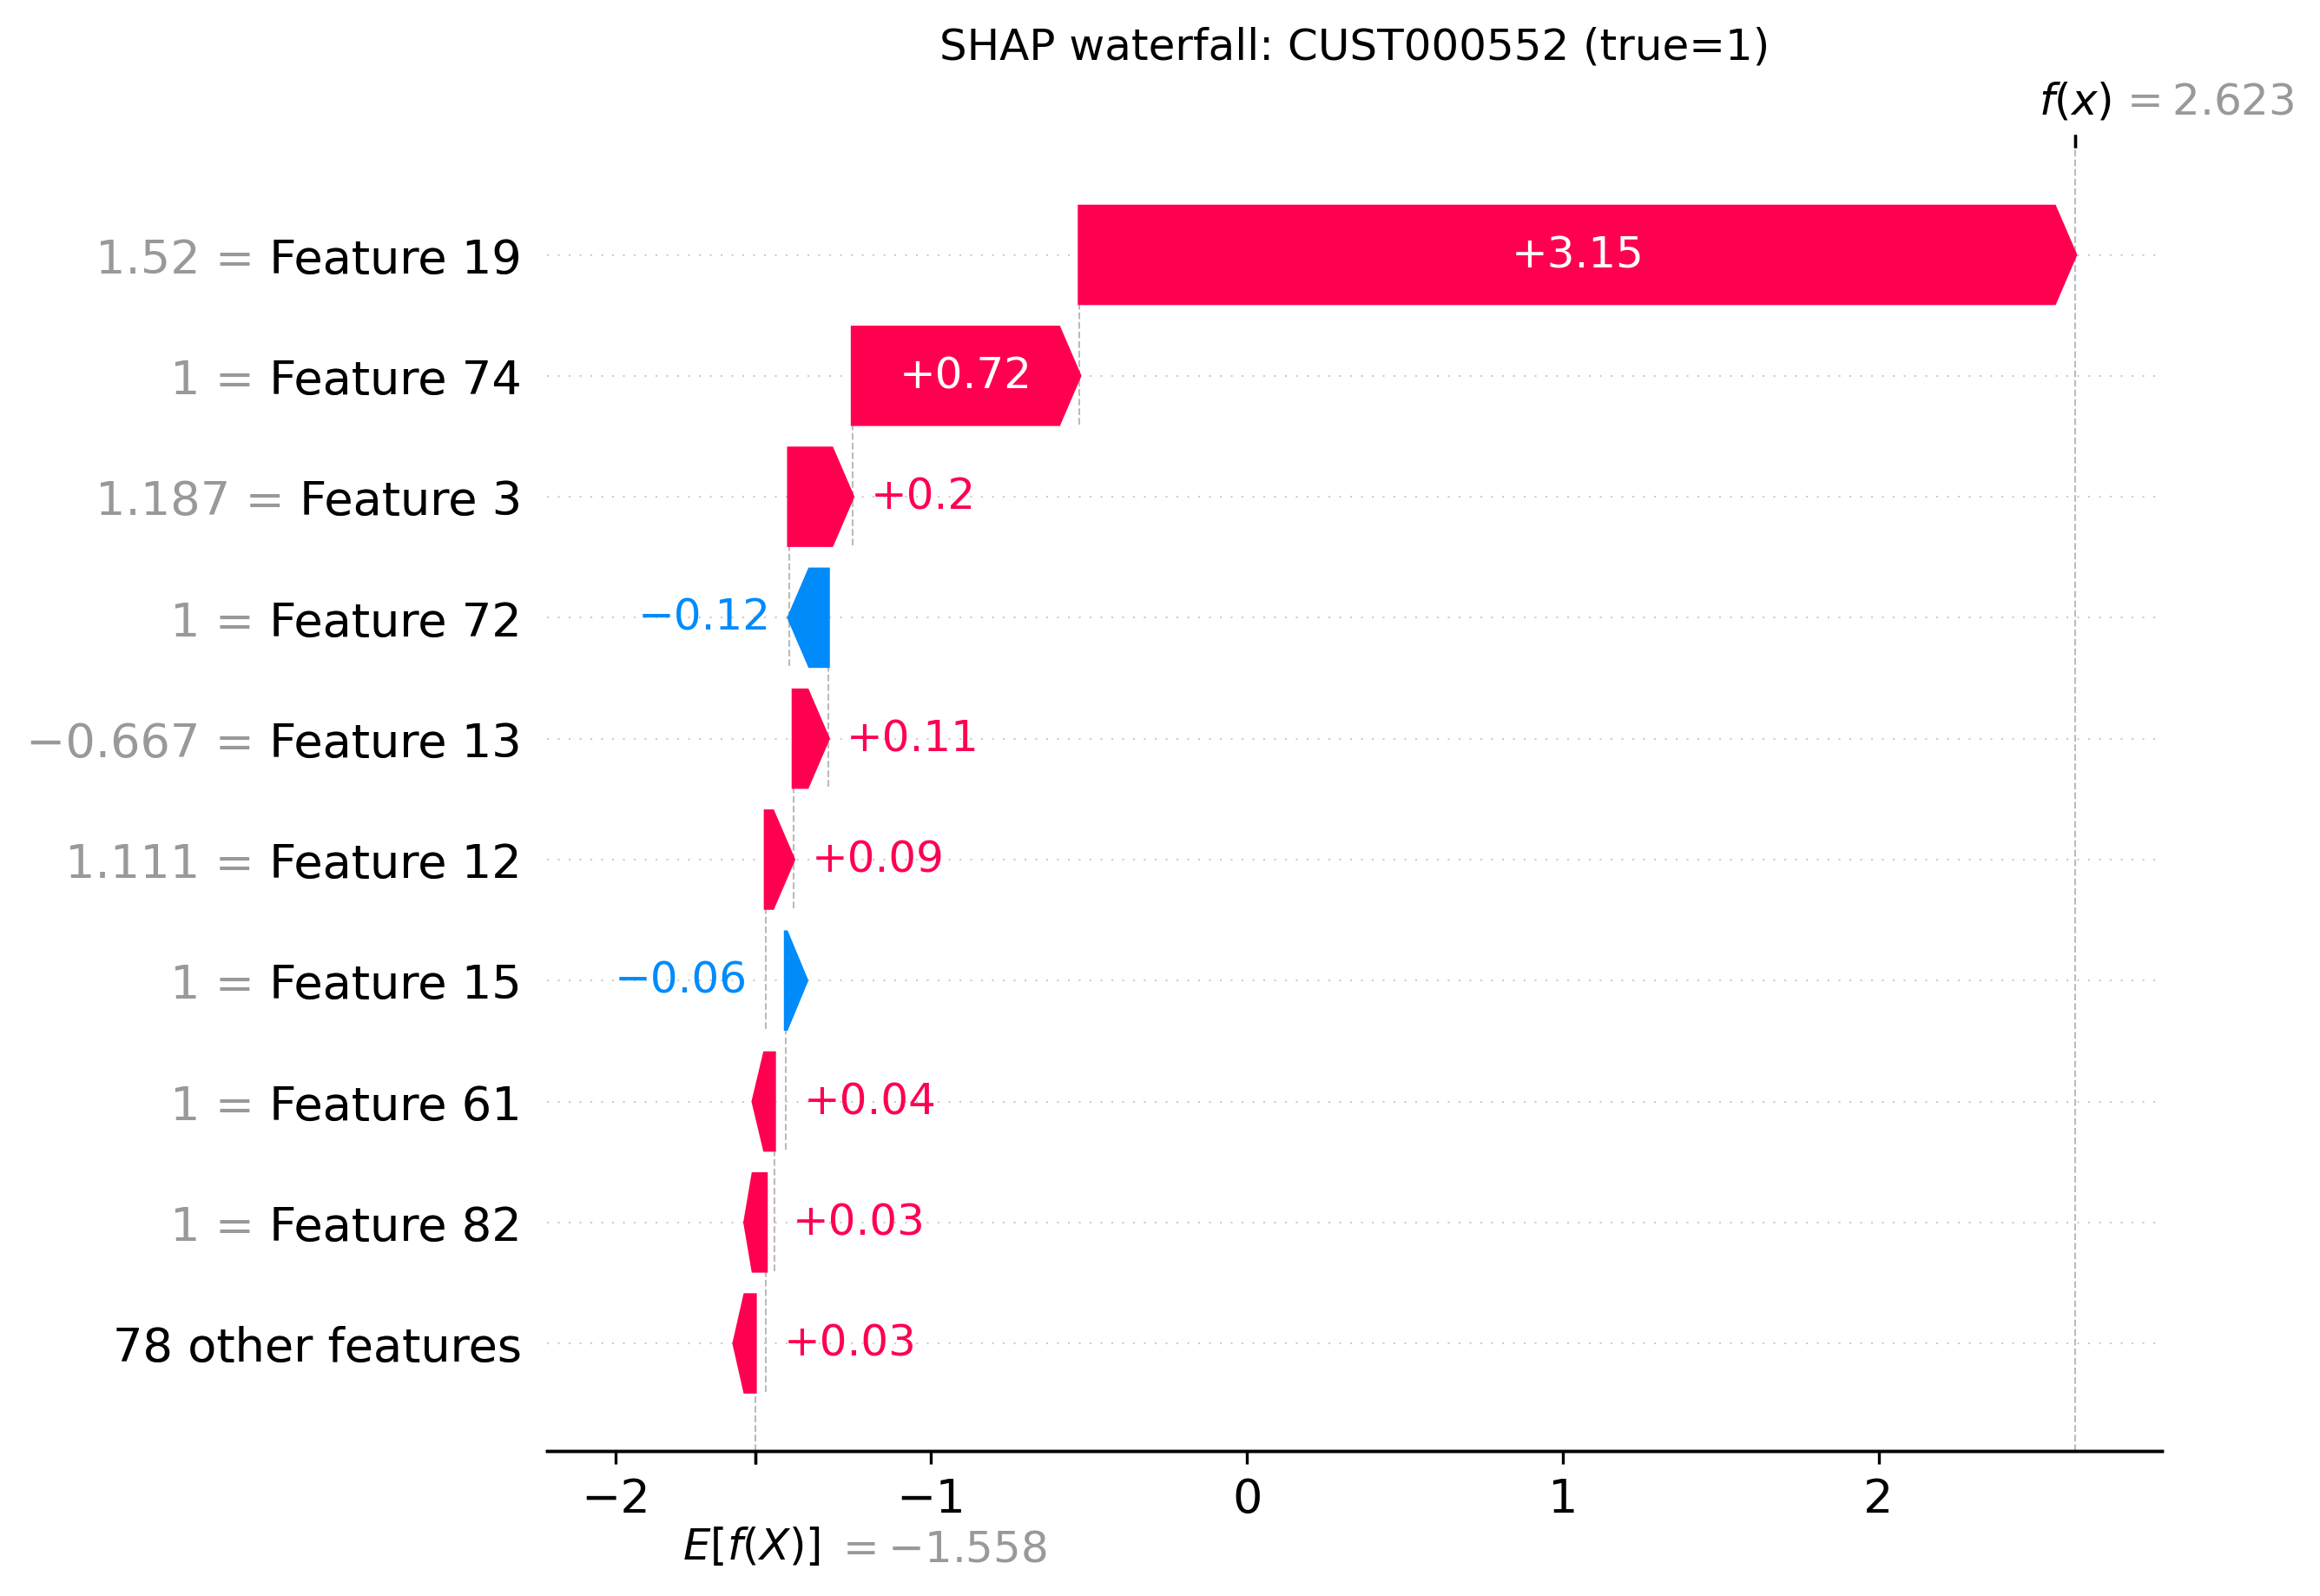
3) Explainability with SHAP
Applied SHAP to explain both global and individual predictions. Waterfall plots illustrate customer-specific drivers of churn and the global summary shows feature impact distribution.
4) ROI Simulation
Simple ROI model assumed €4,000 CLV and a €150 retention offer. Targeting the top 5% highest-risk customers produced a net savings uplift versus random targeting.
Impact
- Predictive Power: CV AUC 0.9310 and test AUC 0.9249 with strong recall (0.8737) and precision (0.9432).
- Business Alignment: ROI-focused targeting strategy.
- Transparency: SHAP explanations make the model actionable and trustworthy.
Tech Stack
Python (scikit-learn, XGBoost, imbalanced-learn, SHAP) • pandas • NumPy • matplotlib • Packaged demo + ROI workbook
Screenshots / Prototype Visuals
Visual explanations of the churn model using SHAP. These plots highlight both global feature importance and individual customer-level drivers of churn.